Showing posts with label Data. Show all posts
Showing posts with label Data. Show all posts
Monday, 29 April 2019
What do 'The 31' enjoy reading?

Thursday, 1 November 2018
Study and Success
Today I returned the Year 9 exams to the students - but not before I recorded their data!
I thought it would be interesting to count the total number of questions each student completed during their opportunity to complete a practice exam during class time.
This is a time-honored study technique. Students attempt practice questions on the material they know they'll be tested on, then get some feedback on it to 1) build their confidence (100% correct already), 2) expand their understanding (getting there) or 3) to fill any gaps in their understanding (unsure).
The practice exam I made for students had sections that exactly mirrored the real one they would sit the next week. The questions only differed a little!
There was a study doc that also matched the practice exam with revision activities, videos, etc, for students to visit and find answers, and I was very happy to help when they asked any questions.
Anyway. Students took varying advantage of this across two lessons, despite my constant circling of the classroom.
Here is the scatter graph of the number of completed questions that I provided feedback on (or were correct but without feedback - I had to include this second category because the student represented by the dot in the top right corner took the practice exam home to study off):

My conclusion was that as a student increases the number of questions they study, the data shows that their number of correct answers in the exam also increases.
The equation on the top right says that for each 1 extra question studied, students were likely to get 0.741 more questions right on the real exam.
This is a nice gradient; the payoff for studying 1 - 2 more questions is to (mostly likely) get at least 1 more question right in the test!
There is one obvious outlier up the top in the middle, where a student studied only 10 questions on the practice exam but got 24 right in the real exam! Maybe they studied at home?
One unlucky person is also about the same distance from the trend line as the student mentioned above. They studied 16 questions but only got 5 right on the exam. Perhaps they were only copying out answers -words and shapes of letters-, rather than trying to understand why the answer was that, while they were studying.
Friday, 20 July 2018
Share - Reflect - Data Analysis
Is there any initial evidence to back up my idea that these SOLO-structured, literacy-focussed, culturally-located learning sequences support learning?
Well, when I created them - no. I went with my gut/teacher instinct and the readings/research I'd already completed, but I had to just make it and then see what happened.
Let's have a look at how the learning went down with my Year 9 class - 9TGn. We began to learn about Ecosystems; in particular what an 'ecological niche' is.
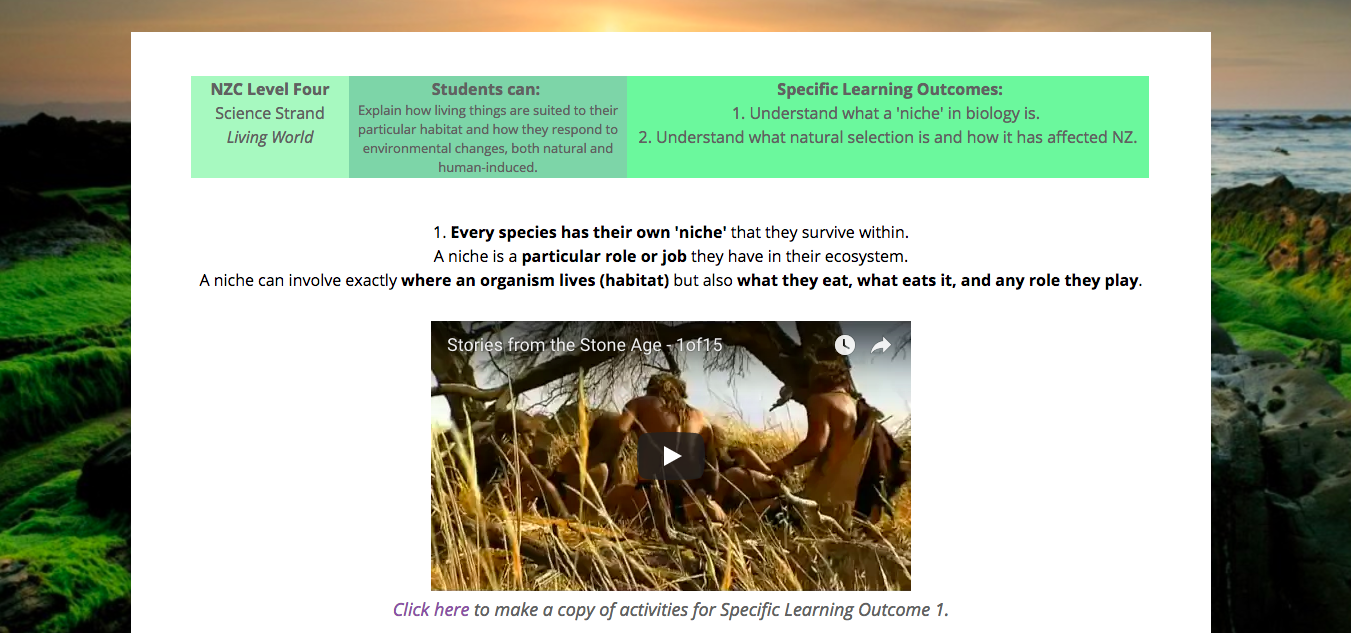
First I introduced the topic and we watched the first 5 minutes of this video on stone-age farmers. Students were mostly engaged. Then they made a copy of the activities for Specific Learning Outcome 1.
Over the course of the week students progressed at different speeds through the learning activities, with me able to float around and discuss the concept and try to motivate them onwards. Students asked for help at different places to one another.
The SOLO activities included students forming their own definition of what an ecological niche was my mixing and merging two online definitions. Then they moved on to complete a guided reading activity in pairs or small groups (which I have already blogged about here), a vocabulary activity that asked students to represent the vocabulary with an image AND in a sentence, and finally the last activity asked them to apply what they had learned about ecological niche's to their own lives (what is their own ecological niche?).
During the last 15 minutes on Friday we 'played' this 10-question Kahoot (which is actually a data-gathering tool for me).
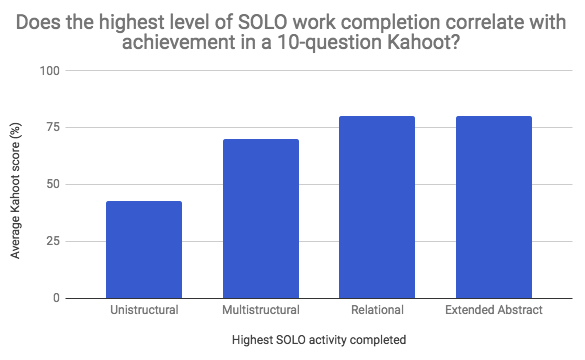
And LOOK at the glorious correlation between kahoot scores and the highest level of SOLO activity that was completed!!
Here is the raw data I used to calculate the averages, if anyone is interested:
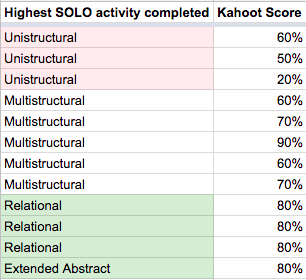
In summary the further that students progressed through the learning activities, the higher they scored (on average) on the 10-question kahoot at the end of the week's learning. One exception to this was a student who only completed the Multistructural activity but scored 90% on the kahoot to take the win - but the overall pattern was still visible.
I will repeat this data analysis next week with a new SLO about 'natural selection.'
Subscribe to:
Posts (Atom)